
Simple Twitter Analytics by Multivac “Data Science Lab” – Part II
In the first part we saw some simple analytics and text extraction over source of each tweets from my Twitter archive. We worked with both Spark Scala APIs and Spark SQL in Apache Zeppelin notebooks hosted by Multivac.
In part II we are going to do the followings:
- Extracting hashtags from content of each tweets
- Make some visualisations with the help of Spark SQL
- Extracting accounts that I have mentioned during last 7 years
- We see my original tweets vs retweeted tweets evolution
As you remember in Part I, we used tweets.csv file which comes with very little metadata. Usually, tweet’s JSON has lots of fields such as Entities that contains hashtags, mentions, URLs, media, etc. But since we don’t have this field in our minimal tweets.csv file we are going to extract hashtags from my tweets content.
Last time for removing HTML tags we used Spark UDF, but this time we are going to use a function that already exists in Spark MlLib. We are going to use a function called “RegexTokenizer“:
RegexTokenizer allows more advanced tokenization based on regular expression (regex) matching. By default, the parameter “pattern” (regex, default:
"\\s+") is used as delimiters to split the input text. Alternatively, users can set parameter “gaps” to false indicating the regex “pattern” denotes “tokens” rather than splitting gaps, and find all matching occurrences as the tokenization result.
Here is how we use it to extract Hashtags from the content of my Tweets:
import org.apache.spark.ml.feature.RegexTokenizer

val hashtagsDF = new RegexTokenizer()
.setGaps(false)
.setPattern("#(\\w+)")
.setMinTokenLength(2)
.setInputCol("text")
.setOutputCol("hashtags")
.transform(newTweetDF)
A little of explanation:
- hashtagsDF: Is going to be a DataFrame with a new column called “hashtags” that contains the results of our RegexTokenizer
- setPattern: This is where we set our regex pattern
- setInputCol: It’s where we get the input which is the “text” of my tweets
- setOutputCol: What should be the name of our output column
- transform: By Apache Spark definition “Scaling, converting, or modifying features”. That’s why we pass “newTweetDF” which is our Tweets DataFrame.
Let’s take a look at our new DataFrame and its schema
hashtagsDF.select("hashtags").show(false)
+---------------------------------------------------------------------------------------+
|hashtags                                                                               |
+---------------------------------------------------------------------------------------+
|[]                                                                                     |
|[#bigdata, #ml]                                                                        |
|[]                                                                                     |
|[#bigda]                                                                               |
|[]                                                                                     |
|[]                                                                                     |
|[]                                                                                     |
|[]                                                                                     |
|[]                                                                                     |
|[#legislatives2017]                                                                    |
|[#journalism, #journalists, #fakenews, #legislatives, #politoscope]                    |
|[#macron, #gouvernementmacron, #gouvernementphilippe, #ministres, #politoscope]        |
|[#innovativesshs, #cnrsinnovation]                                                     |
|[#legislatives2017, #macron]                                                           |
|[#premierministre, #edouardphilippe, #macron, #legislatives2017, #politoscope]         |
|[#premierministre, #edouardphilippe, #macronpresident, #legislatives2017, #politoscope]|
|[#premierministre, #edouardphilippe, #macronpresident, #legislatives2017]              |
|[]                                                                                     |
|[#innovativesshs, #cnrsinnovation]                                                     |
|[]                                                                                     |
+---------------------------------------------------------------------------------------+
only showing top 20 rows
hashtagsDF.printSchema
root
 |-- tweet_id: string (nullable = true)
 |-- in_reply_to_status_id: string (nullable = true)
 |-- in_reply_to_user_id: string (nullable = true)
 |-- timestamp: string (nullable = true)
 |-- source: string (nullable = true)
 |-- text: string (nullable = true)
 |-- retweeted_status_id: string (nullable = true)
 |-- retweeted_status_user_id: string (nullable = true)
 |-- retweeted_status_timestamp: string (nullable = true)
 |-- expanded_urls: string (nullable = true)
 |-- cleanSource: string (nullable = true)
 |-- hashtags: array (nullable = true)
 |    |-- element: string (containsNull = true)
OK! So the the column “hashtags” is an array pf strings and it can be also empty as I may have not mentioned any hashtag in my tweet.
How many unique hashtags I have used and what are the top 20s:
val hastagsFreq = hashtagsDF.select(explode($"hashtags").as("value")).groupBy("value").count
hastagsFreq.count()

res15: Long = 747
hastagsFreq.sort($"count".desc).show(20, false)

+-------------------+-----+
|value              |count|
+-------------------+-----+
|#bigdata           |76   |
|#aws               |73   |
|#politoscope       |62   |
|#mongodb           |53   |
|#mwc14             |42   |
|#presidentielle2017|38   |
|#nodejs            |36   |
|#ec2               |36   |
|#nowplaying        |34   |
|#nowwatching       |28   |
|#eccs13            |27   |
|#macron            |21   |
|#hadoop            |18   |
|#ios               |18   |
|#elasticsearch     |16   |
|#mahmeri           |16   |
|#redis             |16   |
|#analytics         |16   |
|#paris             |15   |
|#terradata         |11   |
+-------------------+-----+
only showing top 20 rows
Now let’s create a temporary view to run some SQL queries for visualisations:
hashtagsDF.select(explode($"hashtags").as("hashtag")).createOrReplaceTempView("MyHashtags")

//The SQL block
%sql
SELECT hashtag, count(*) as Count FROM MyHashtags
GROUP BY hashtag
ORDER BY Count DESC
LIMIT ${limit=20}
As you have noticed there is a variable inside the SQL statement “${limit=20}”. This will create an input field for easily pass some values:

As nice and helpful as this could be, I still want to see the evolution of my hashtags through the time. So let’s run this SQL statement and see the visualisations:
SELECT *
FROM(
    SELECT *, ROW_NUMBER() OVER(PARTITION BY t.YEAR ORDER BY t.TotalCount DESC) as rank
    FROM(
        SELECT year(timestamp) as YEAR, hashtag, count(1) as TotalCount
        FROM MyHashtags
        GROUP BY hashtag, year(timestamp)
    )t
)WHERE rank <= 10
This will show top 10 hashtags in each year:

This tells me I used to tweet about #aws a lot back during 2013 and 2014. To dig deeper we can use Area Chart with Stream option and select #aws:

It’s time to do the same thing with my @mentions. First we create a new DataFrame which contains a extracted mentions:
val mentionsDF = new RegexTokenizer()
.setGaps(false)
.setPattern("@(\\w+)")//anything starts with @
.setMinTokenLength(2)
.setInputCol("text")
.setOutputCol("mentions")// extracted mentions
.transform(newTweetDF)
I am interested in how many unique accounts have I ever mentioned:
val mentionsFreq = mentionsDF.select(explode($"mentions").as("value")).groupBy("value").count
mentionsFreq.count()

res108: Long = 1044
Since the result is a DataFrame I can display the top 10 accounts I have ever mentioned:
mentionsFreq.sort($"count".desc).show(10, false)
+-----------+-----+
|value      |count|
+-----------+-----+
|@verge     |368  |
|@scoopit   |358  |
|@cultofmac |168  |
|@techcrunch|144  |
|@iscpif    |106  |
|@engadget  |104  |
|@mashable  |101  |
|@gracegynda|92   |
|@thenextweb|87   |
|@cnet      |72   |
+-----------+-----+
only showing top 10 rows
However, it is more interesting to see the top 10 mentions of each year:
SELECT *
FROM(
    SELECT *, ROW_NUMBER() OVER(PARTITION BY t.YEAR ORDER BY t.TotalCount DESC) as rank
    FROM(
        SELECT year(timestamp) as YEAR, mention, count(1) as TotalCount
        FROM MyMentions
        GROUP BY mention, year(timestamp)
    )t
)WHERE rank <= 10
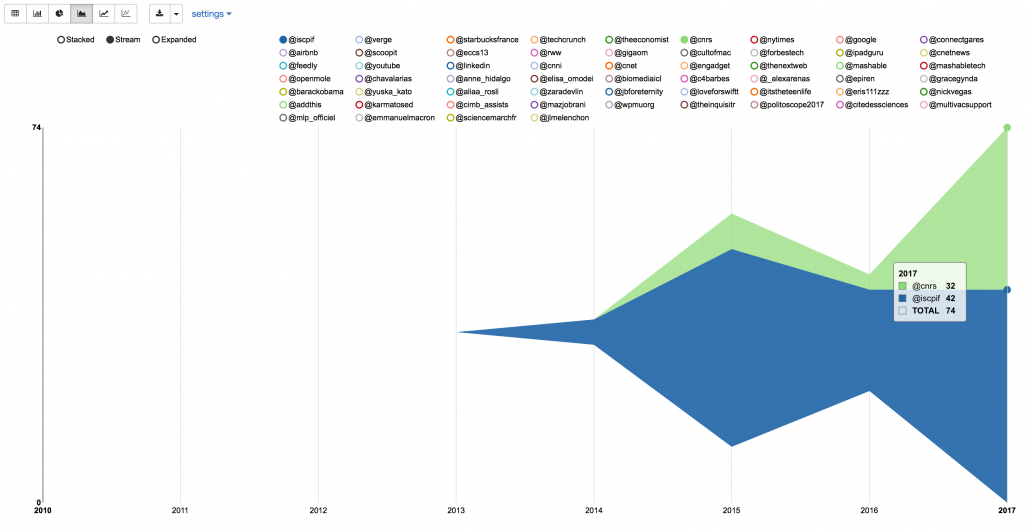
This is a visualisation of my top mentions by year:

This chart shows me when and how much I mentioned @iscpif and @cnrs:

Well that makes sense since I joined ISC-PIF/CNRS in 2014 🙂

Leave a Reply
Want to join the discussion?Feel free to contribute!