Make your first map in 10 min (Part 1/2)
version 3.0.5.7
version 3.0.5.7
Note : click on the hot spots in the images to get more explanation.
Context
Gargantext is designed to produce living maps that evolve as you work with them. They can be used for dressing a state-of-the-art, mapping a bunch of documents, setting up a collective representation of a problem, etc. The map is not the ultimate goal, rather, it is the back and forth between the different levels of your corpora (document, terms, maps, etc.) that is the main resource and help you to build an adaptive representation of a question or a problem.
This tutorial explain you how to build the first map that will bootstrap your work with Gargantext. This first map should take few minutes.
Gargantext is a free and open source software developed by the CNRS Complex Systems Institute of Paris Ile-de-France (ISC-PIF). Its source code is available on Github.
An instance of Gargantext is running on the ISC-PIF Cloud at http://gargantext.org To access this Gargantext instance, you will first have to register the ISC-PIF services.
Step 1 : create your project
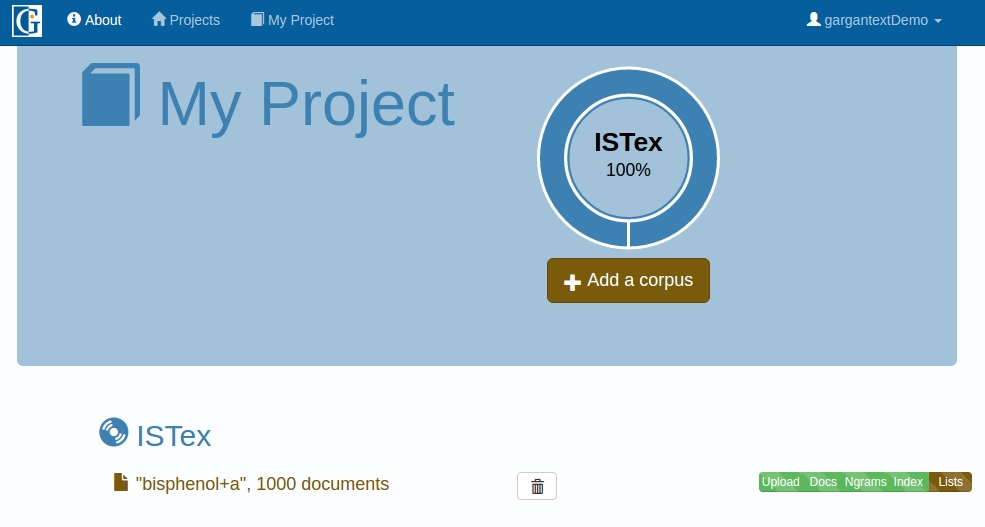
On http://gargantext.org, first log-in, then create your first project (here named ‘My Project’). A project is a set of analyses on different corpora that share a same thematic.

Click here to create a project.
Once created, your project is listed here. To access the project, click on its name.
Step 2 : create an analysis by defining your corpus
An analysis starts with the definition of a set of documents to analyze. Gargantext accepts many input formats (RIS, ISI, zotero, csv, etc.) and new formats are added when there is a sufficient demand for it.
Gargantext is also connected to large open databases that makes it possible to query them directly through Gargantext. For now, the following archives are available (some access restriction might apply depending on the provider) :
- Istex, the CNRS retrospective digital archiving of Science
- PubMed, the main biomedical archive,
- Scoap3, the Open Access Publishing in Particle Physics
To create an analysis, click on the button ‘Import Corpus’.

Click here to import a corpus

Drop down list to define the input format

Istex is connected through an API, you can import directly some documents via Gargantext.
Click on No to the question ‘do you have a file already ?’ You will be able to query directly from Gargantext.
Enter you query here like « bisphenol A »
Click on « scan » to get the number of documents matching your query (here 18972).
Clicl here to launch the analysis on a sample of the available publications.

This indicates the distribution of the types of documents in your project.
This indicates the progression of the analysis. When Gargantext has finished its works you receive an email and the progress bar is replaced by the icon
This indicate the name of your corpora along with the number of documents. Click on the name to access the analysis.
Step 3 : Generate your first map
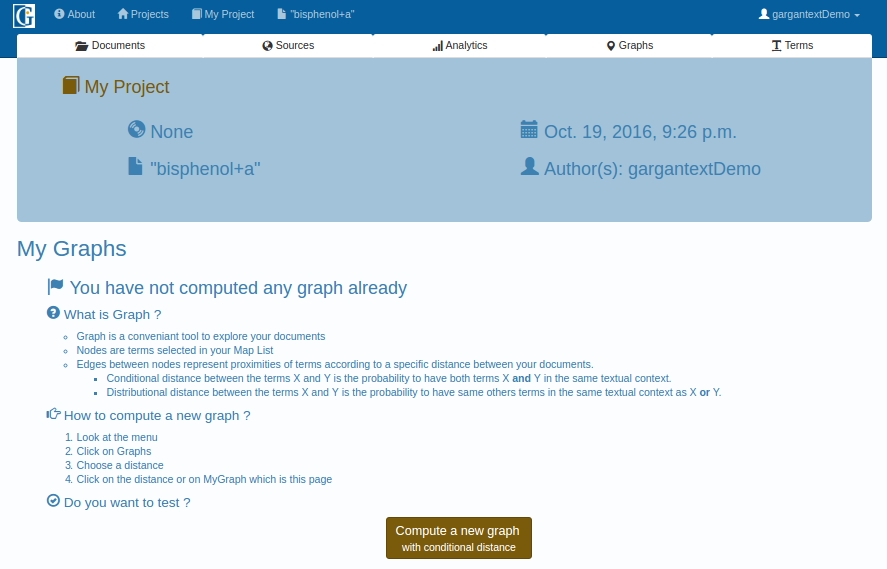
At the end of the import of your corpus, Gargantext display you a panel to explore your documents. It has also identified 350 terms that have been considered as statistically relevant for the topic covered by your corpora. You can start to generate a first map on these 350 terms that, although not perfect, will give you a first insight into the topics covered by your corpora. To generate a map, click on the ‘Graphs’ tab and go to the MyGraph page.

This indicates the distribution through time of the documents contained in your corpora.
Click here and then on « MyGraph » to access the page where you will be able to generate the first map.

Click here to generate the first map.
Step 4 : Visualize the map
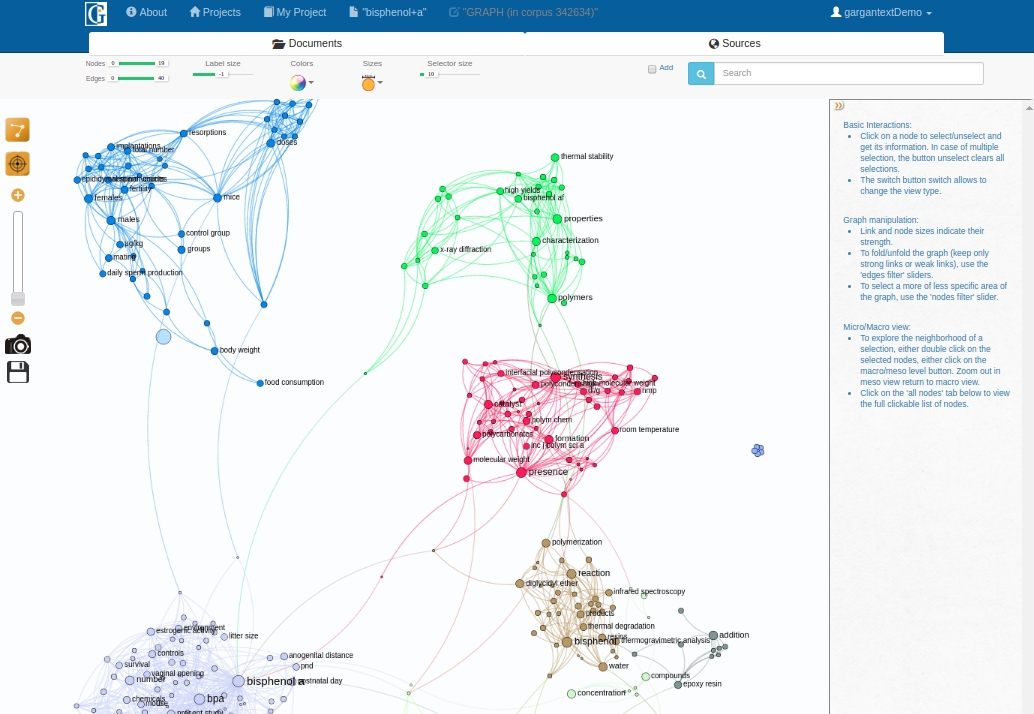
In the map view, you can access to a high level and synthetic view of your corpora in the form of a graph. Nodes are the terms that are considered as relevant for your topic. Link are proximities between these terms as inferred from the analysis of the whole corpora. Two different measures of proximity are currently implemented :
- The conditional proximity. This is simply the probability of having term B in a document knowing that it already contain term A. This distance will give you the landscape of interactions between terms in your corpora. It is best suited for large enough corpora (>500).
- The distributional proximity. This proximity measure compares, for two terms A and B the similarity of their co-occurrence profiles with all the other terms of the maps. This is not an indication of interaction (two terms can be linked without occurring even once together in the corpora) but it assesses a kind of structural equivalence. For exemple synonyms will have a high probability to be linked.
Bad spatialization

If your map is messy, click here to start the reorganization of the nodes. Nodes with same color should be close. When you are satisfied with the presentation, click again here to stop the reorganization and display the links
Good spatialization

If your map is messy, click here to start the reorganization of the nodes. Nodes with same color should be close. When you are satisfied with the presentation, click again here to stop the reorganization and display the links
The visualization engine has an algorithm that maximizes the information conveyed by a map by positioning the nodes that are strongly related close on the map. The spatialization button makes it possible you to run this algorithm when you load the map or when you filter some edges/nodes. Click to launch the algorithm and click again to stop it. Links and labels are not displayed during repositioning of nodes.
At the end of the repositioning, nodes with the same color should be close on the map.


