Climatoscope
When the media or us talk about climate change, we mean temperatures, storms, droughts, cyclones, polar bears ; while the researchers talk about observations, circulation models, temperature anomalies …
But do the concerns of scientists sometime converge with those of the general public and media? This is what you can see thanks to climate Tweetoscope which offers interactive exploration of topics related to climate change and its consequences. Analyzing news in the web since May 2015 with Twitter as a proxy, the Tweetoscope aims to provide an evolving collective representation of questions and debates on this major societal issue.
This platform has been first presented from Oct 2015 to March 2016 at the exhibition le Climat à 360° of the Museum Cité des Science et de l’Industrie in Paris.
In 2018, the Climate Tweetoscope became part of the Places and Spaces Macroscope exhibition organized by the Cyberinfrastructure for Network Science Center at Indiana University.
The 2015 semantic map of climate change researches is available in editable format here (licence CC 3.0)
Authors
- David Chavalarias, CNRS-CAMS/ISC-PIF, Principal investigator, maps of science and interactive visualizations,
- Maziyar Panahi, CNRS/ISC-PIF, big data processing and back-end.
Other contributor :
- Samuel Castillo, CNRS-ISC-PIF, interactive visualizations and front end,
Supports
We kindly thanks for their support :
- Universcience, Cité des Sciences et de l’Industrie
- Projet Science en Poche, (Emergence(s), Ville de Paris)
- Projet Mastodons ARESOS,
- Thomson Reuter Web of Science.,
- Institut des Systèmes Complexes de Paris Ile-de-France (CNRS and partners)
- Centre d’Analyse et de Mathématiques Sociales (CAMP, EHESS)
Credits
- SigmaJS for the javascript network rendering,
- Cortext Plateform for the text-mining and computing of the maps,
- Gargantext for text-mining and exploration of first maps,
- MongoDB
- Elastic Search
A lire : Le Tweetoscope climatique
La lettre de l’INSHS a accordé un article au Tweetoscope Climatique dans son numéro de novembre 2015.
Exhibitions
![]() The Climate Tweetoscope has been presented from Oct 2015 to March 2016 at the exhibition le Climat à 360° of the Museum Cité des Science et de l’Industrie in Paris.
The Climate Tweetoscope has been presented from Oct 2015 to March 2016 at the exhibition le Climat à 360° of the Museum Cité des Science et de l’Industrie in Paris.
![]() The Climate Tweetoscope is part since 2018 Places and Spaces Macroscope exhibition organized by the Cyberinfrastructure for Network Science Center at Indiana University.
The Climate Tweetoscope is part since 2018 Places and Spaces Macroscope exhibition organized by the Cyberinfrastructure for Network Science Center at Indiana University.
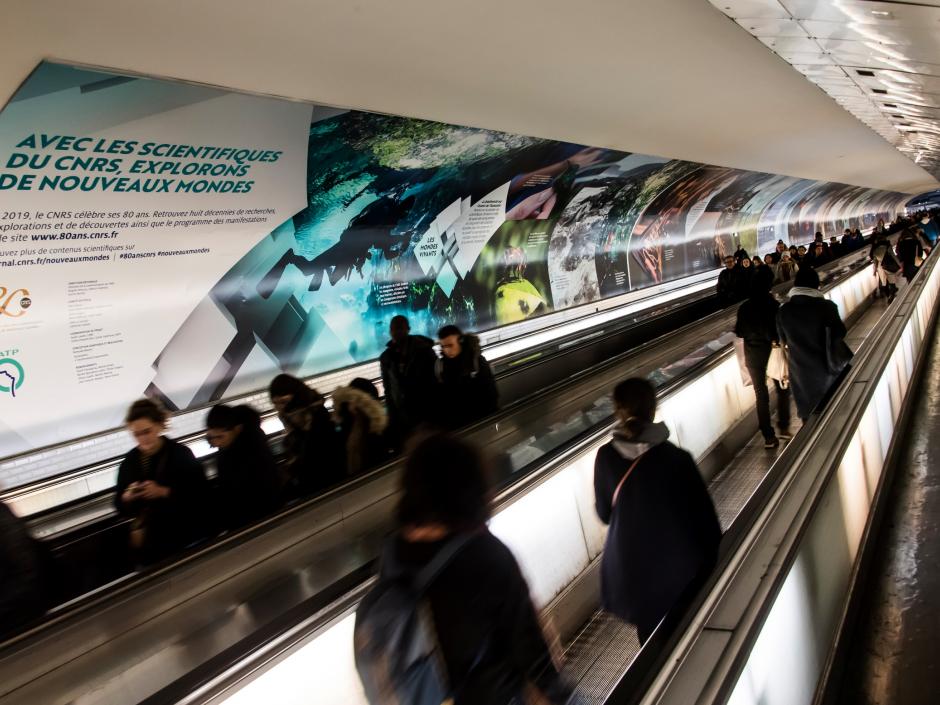
 The Climate Tweetoscope is part of the Montparnasse Station exhibition for the 80 anniversary of CNRS